

Share


“If you can’t measure it, you can’t improve it.” - Peter Drucker
In XPRT Magazine #15, the first article on sustainable software engineering to benefit our climate was published. In this article, we’d like to revisit this subject with a focus on measuring carbon emissions on Azure. Without measuring our baseline, we can’t start working on carbon efficiency. Before we dive in, let’s do a quick recap. Sustainable Software Engineering is about five dimensions:

Source: https://se.ewi.tudelft.nl/research-lines/sustainable-se/
In this article, we focus on “Environmental”. We’ll dive further into how to nurture a greener environment through clever software engineering on Azure. This can be done by reducing the carbon footprint of our operational software in the cloud. Or perhaps we can shift to the left and reduce carbon emissions while designing and building software. But before optimizing for carbon emissions, we must measure a baseline and we need principles to guide our journey toward greener software. That is where The Green Software Foundation (GSF) comes in, as you might remember from the previous article. However, we need to revisit GSF principles.
The Green Software Foundation’s 3 Principles
The GSF is a non-profit organization dedicated to mitigating the environmental impact of software (https://greensoftware.foundation/). As opposed to the former article, the GSF streamlined its principles to the three following principles: * Energy Efficiency * Hardware Efficiency * Carbon Awareness

Three principles are easier to remember and make it more streamlined to adhere to. However, before you can work on “Energy Efficiency,” “Hardware Efficiency,” and “Carbon Awareness” of your operational software on Azure, you’ll need to measure your carbon footprint to establish a baseline. Microsoft has released the Carbon Optimization Service on Azure and an accompanying REST API! That is excellent news. Measuring your carbon emissions on Azure has become a lot more accessible. Let’s look at the Carbon Optimization Service and its API.
Carbon Optimization Service
Type “carbon optimization” in your search bar in the Azure Portal, and you’ll find the Carbon Optimization Service. It uses Azure’s RBAC for authorization and, therefore, introduces a new role: Carbon Optimization Reader Role. Acquire this role, and you will be ready to go! The Carbon Optimization Service starts up with the emission trends:
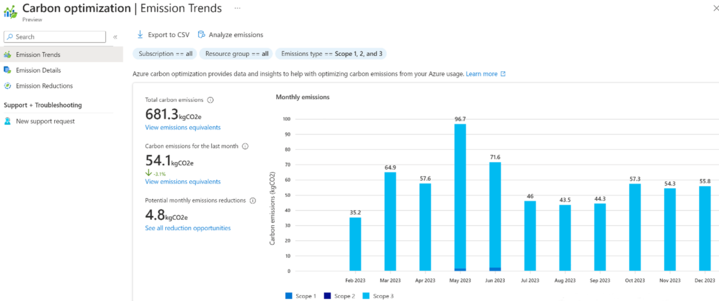
The above screenshot shows the carbon emission metrics that can be used in your reports, such as the Corporate Sustainability Reporting Directive (CSRD) in Europe or the Securities and Exchange Commission (SEC) in the USA. We don’t want to stop there because we want to drill into our carbon emissions to start carbon optimizing our software landscape on Azure. That is why you would want to click on Emission Details:
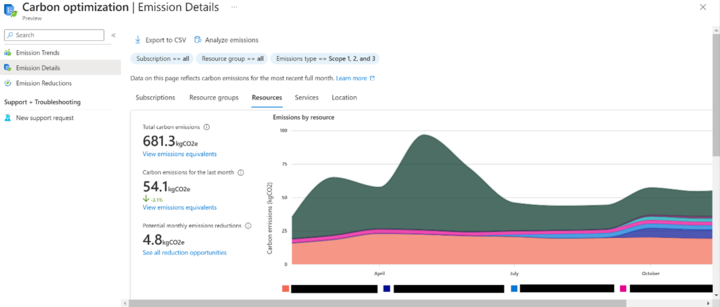
On this tab, you can drill down on your carbon emissions even per resource, as shown in the screenshot (resource names made black by me). Other levels are subscriptions, resource groups, services (all your Virtual Machines or Function Apps, etc.), and location. If you are done establishing a baseline for the carbon emissions of every resource in your subscriptions, you could even click on “Emission Reductions” and get some suggested recommendations:
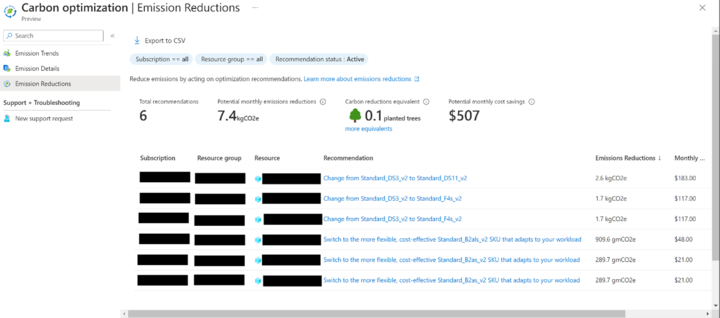
Currently, I think the suggestions will mostly align with the suggestions you get regarding cost management in Azure Advisor. It even has a “Monthly Cost Savings” column at the end. Cost can be a good proxy for carbon emissions, but you can never mindlessly follow cost savings. It is good to keep this in mind.
Clicking through this service on the Azure Portal and exporting data is good, to begin with, and an excellent start for reporting your carbon emissions on the Azure cloud. But sooner or later, you’ll want to programmatically retrieve carbon emissions from your resources on Azure to process them further in a CI/CD pipeline or some kind of sustainability tool, etc. Let’s look at the new Carbon Optimization REST API!
Carbon Optimization REST API
There are several benefits to the new API. First, it uses regular authentication and authorization with RBAC and Microsoft Entra ID, like all the other modern APIs on Azure. All you need to do is: * Create a client in Microsoft Entra ID (which is called an App Registration); * Make sure the client has the new Carbon Optimization Reader role; * Make a note of the client ID (application ID on Azure) and the client Secret after creating the client After that, you’re all set to go! I made a Console App in C#.NET to test the API. To authenticate, we’ll first need the following lines of code:
 string authority = "https://login.microsoftonline.com/"+ tenantId;
string[] scopes = new string[] { "https://management.azure.com/.default" };
string[] subscriptions = new string[] {
    "[SUBSCRIPTION ID]"
};
Replace tenantId with your tenant’s ID. Then, we are going to acquire an access token for this client:
var app = ConfidentialClientApplicationBuilder.Create(clientId)
    .WithClientSecret(clientSecret)
    .WithAuthority(authority)
   .Build();

var authenticationResult = await app.AcquireTokenForClient(scopes).ExecuteAsync();

string accessToken = authenticationResult.AccessToken;
Replace clientId and clientSecret with the client ID and client secret of the client you made earlier with the Carbon Optimization Reader role. After retrieving an access token, we can call the Carbon Optimization API. At the moment of writing this, we have two endpoints: * List Carbon Emission Reports * Query Carbon Emission Data Available Date Range
Let’s first retrieve the available data range.
Query Carbon Emission Data Available Data Range
It makes sense first to retrieve the available data range for the carbon emission data so we won’t make a call to list the carbon emission reports with an invalid data range. The C# code for this looks like:
using (HttpClient client = new HttpClient())
{
    client.DefaultRequestHeaders.Authorization = new AuthenticationHeaderValue("Bearer", accessToken);

   string queryCarbonEmissionDataAvailableDateRangeUrl = "https://management.azure.com/providers/Microsoft.Carbon/queryCarbonEmissionDataAvailableDateRange?api-version=2023-04-01-preview";
    HttpResponseMessage response = await client.PostAsync(queryCarbonEmissionDataAvailableDateRangeUrl, null);

    string responseContent = await response.Content.ReadAsStringAsync();
    Console.WriteLine(responseContent);
}
Note how the access token we retrieved earlier is used in the authentication header as a bearer token. Also, note how the URL begins with the general URL “https://management.azure.com/providers/” then specifies the provider “Microsoft.Carbon/”, then selects the endpoint “queryCarbonEmissionDataAvailableDateRange” and how it finishes with the query parameter “api-version=2023-04-01-preview”. Bear in mind this is all in preview and could change at any time. Observe it’s a POST method. When we execute this POST call on the endpoint via the HTTP client, we get the following response:
{
    "endDate": "2024-01-01",
    "startDate": "2022-02-01"
}
List Carbon Emission Reports
In the subsequent call, let’s use this data range to obtain detailed resource-level emission data. I am most interested in this call because previously, it wasn’t possible to get carbon emission data on the resource level with the Sustainability API. I am very excited to see it on resource level! This would look in C# like:
DateRangeResponse dateRange = JsonConvert.DeserializeObject<DateRangeResponse>(responseContent);

DateRangeRequest dateRangeRequest = new DateRangeRequest
{
   StartDate = dateRange.StartDate,
    EndDate = dateRange.EndDate
};

ItemDetailsQueryFilter itemDetailsQueryFilter = new ItemDetailsQueryFilter
{
   CarbonScopeList = [EmissionScopeEnum.Scope1.ToString(), EmissionScopeEnum.Scope2.ToString(),
    EmissionScopeEnum.Scope3.ToString()],
   CategoryType = CategoryTypeEnum.Resource.ToString(),
   DateRange = dateRangeRequest,
   OrderBy = OrderByEnum.TotalCarbonEmission.ToString(),
    PageSize = 10,
   ReportType = ReportTypeEnum.ItemDetailReport.ToString(),
    ResourceGroupUrlList = Array.Empty<string>(),
    SortDirection = SortDirectionEnum.Asc.ToString(),
    SubscriptionList = subscriptions
};
string itemDetailsQueryFilterAsJson = JsonConvert.SerializeObject(itemDetailsQueryFilter);
StringContent itemDetailsQueryFilterAsStringContent = new
    StringContent(itemDetailsQueryFilterAsJson, Encoding.UTF8, "application/json");

string carbonUrl =
    "https://management.azure.com/providers/Microsoft.Carbon/carbonEmissionReports?api-
    version=2023-04-01-preview";
>HttpResponseMessage postResponse = await client.PostAsync(carbonUrl,
    itemDetailsQueryFilterAsStringContent);
string postResponseContent = await postResponse.Content.ReadAsStringAsync();
Console.WriteLine(postResponseContent);
First, the DataRangeResponse object is turned into a DataRangeRequest object. Because if you look at the DataRangeResponse object, it looks like this:
internal class DateRangeResponse
{
   [JsonProperty("startDate")]
    public string StartDate { get; set; }
    [JsonProperty("endDate")]
    public string EndDate { get; set; }
}
And if you look at the DataRangeRequest object, it looks like this:
internal class DateRangeRequest
{
    [JsonProperty("start")]
    public string StartDate { get; set; }
    [JsonProperty("end")]
    public string EndDate { get; set; }
}
Please note the difference in the JSON properties, startDate vs. start and endDate vs. end. With the proper DataRangeRequest object, we can construct the ItemDetailsQueryFilter object, which looks like this:
internal class ItemDetailsQueryFilter
{
   [JsonProperty("carbonScopeList")]
   public string[] CarbonScopeList { get; set; }

    [JsonProperty("categoryType")]
    public string CategoryType { get; set; }

    [JsonProperty("dateRange")]
    public DateRangeRequest DateRange { get; set; }

   //[JsonProperty("groupCategory")]
    //public string GroupCategory { get; set; }

    [JsonProperty("orderBy")]
    public string OrderBy { get; set; }

    [JsonProperty("pageSize")]
    public int PageSize { get; set; }

    [JsonProperty("reportType")]
   public string ReportType { get; set; }

    [JsonProperty("sortDirection")]
    public string SortDirection { get; set; }

    [JsonProperty("subscriptionList")]
    public string[] SubscriptionList { get; set; }

   [JsonProperty("resourceGroupUrlList")]
    public string[] ResourceGroupUrlList { get; set; }

  [JsonProperty("skipToken")]
    public string SkipToken { get; set; }
}
Please note that GroupCategory is commented out. I got an error when I tried to pass it along empty, or with valid values. Apparently you can ignore the group category name here because this is ResourceItemDetailsData, which I learned from Microsoft. Other flavors where this value will be relevant would be when you are grouping by Subscription, ResourceGroup, and so on. Also, note that Skiptoken is ignored for now, but you can use this to get to the next page; see PageSize. The enumerations used to construct the ItemDetailsQueryFilter object are
internal enum EmissionScopeEnum
{
    Scope1,
    Scope2,
    Scope3
}

internal enum CategoryTypeEnum
{
    Location,
    Resource,
    ResourceGroup,
    ServiceType,
    Subscription
}

internal enum SortDirectionEnum
{
    Asc,
    Desc
}

internal enum OrderByEnum
{
    Name,
    TotalCarbonEmission,
    TotalCarbonEmissionLastMonth,
    SubscriptionId
}

internal enum ReportTypeEnum
{
    ItemDetailReport,
    OverallSummaryReport
}

internal enum GroupCategoryEnum
{
    ResourceGroup,
    SubscriptionId
}
Note how it is ItemDetailReport for ReportTypeEnum and not ItemDetailsReport (see the missing ‘s’).
Full descriptions for the attributes of the ItemDetailsQueryFilter are as follows: * carbonScopeList (Required, EmissionScopeEnum[]): This array defines the scopes of carbon emissions to be included in the query. Carbon emission scopes typically have Scope 1 (direct emissions from owned or controlled sources), Scope 2 (indirect emissions from the generation of purchased energy), and Scope 3 (all other indirect emissions that occur in a company’s value chain). Developers need to specify which of these scopes they want to include in the emissions data retrieval, ensuring the data reflects the specific environmental impact areas relevant to their analysis. * categoryType (Required, CategoryTypeEnum): This property indicates the type of item categories to consider in the emissions data report. The category type could range from resource types, service types, locations, etc. It helps categorize the emissions data based on the specified dimension, providing a clearer view of which areas contribute to the carbon footprint, thus allowing for targeted sustainability efforts. * dateRange (Required, DateRange): Specifies the start and end dates for the period over which carbon emissions data should be retrieved. This allows developers to define a specific time frame for analysis, enabling the tracking of emissions over time, identifying trends, and evaluating the effectiveness of carbon reduction strategies. * group category (Required, string): Defines the group category name for which the emissions data should be aggregated. This could be a resource group, service category, or other relevant grouping criterion. It allows for more granular analysis within the broader category types, aiding in pinpointing specific areas of high emissions within a category. * orderBy (Required, string): Determines the column name by which the returned items should be ordered. This could refer to any relevant data field, such as total emissions, service name, etc. Calling the results makes the data more readable and helps quickly identify the most significant contributors to the carbon footprint. * pageSize (Required, integer): Dictates the number of items to return in one response. This allows developers to manage the volume of data produced by the API, facilitating easier data handling and analysis, especially when dealing with large sets of emissions data. * reportType (Required, string: ItemDetailReport): Specifies the type of report to generate. In this case, the report type is set to ItemDetailReport (not ItemDetailsReport), which indicates that the query aims to retrieve detailed carbon emissions data. This report type is crucial for deep-diving into specific items or categories to understand their carbon emission levels. * sortDirection (Required, string): Specifies the direction of sorting for the query results, such as ascending or descending. This affects the order in which items are presented in the report, aiding in data interpretation by highlighting the highest or lowest emitters based on the chosen sort criterion. * subscriptionList (Required, string[]): An array of subscription IDs for which carbon emissions data should be retrieved. This allows data to be filtered to include only specific Azure subscriptions, making the analysis relevant to the selected cloud resources and services. * resourceGroupUrlList (Optional, string[]): This optional array specifies the resource group URLs for retrieving emissions data. Including specific resource groups can further narrow the data retrieval to pertinent areas, enabling a more focused analysis of particular segments of an Azure subscription. * skipToken (Optional, string): This is used for pagination; it specifies the number of result items to skip. This is particularly useful when dealing with large datasets, as it allows developers to navigate through the results incrementally, retrieving manageable chunks of data at a time.
We proceed by calling the URL:
https://management.azure.com/providers/Microsoft.Carbon/carbonEmissionReports?api-version=2023-04-01-preview
Which is a POST method again. It expects different attributes based on the value of the report type. In our case, we specified ItemDetailReport and passed the attributes with appropriate values for these attributes. And after we’ve called the client, we receive…
An error??
When writing this blog post, the API does not yet support the ItemDetailReport for multiple months. We’ll have to rewrite the piece of code where the DateRangeRequest object was created as follows:
DateRangeRequest dateRangeRequest = new DateRangeRequest
{
    StartDate = "2024-01-01",
    EndDate = "2024-01-01"
};
This will give us detailed emission data on the resource level for January 2024. Adjust this for a month for which you have carbon emission data. This probably has to do with the fact that carbon emission data is basically only per month and is even a month behind. I hope Microsoft will improve this. For now, after we have applied this workaround, we received the following response:
 {
    "skipToken": "",
    "value": [
        {
            "categoryType": "Resource",
            "changeRatioFor12Months": 0,
            "changeRatioForLastMonth": 0,
            "changeValueMonthOverMonth": 0.157786430917075,
            "dataType": "ResourceItemDetailsData",
            "groupName": "",
            "itemName": "dirtyvm",
            "resourceGroup": "dirty-console-app-rg",
            "resourceId": "/subscriptions/[SUBSCRIPTION ID]/resourcegroups/dirty-console-app-rg/providers/microsoft.compute/virtualmachines/dirtyvm",
            "resourceType": "microsoft.compute/virtualmachines",
            "subscriptionId": " [SUBSCRIPTION ID]",
            "totalCarbonEmission": 0.157786430917075,
            "totalCarbonEmission12MonthsAgo": 0,
            "totalCarbonEmissionLastMonth": 0
        }
    ]
}
The C# class for the collection class looks like:
internal class CarbonEmissionDataListResult
 {
     [JsonProperty("skipToken")]
     public string SkipToken { get; set; }
     [JsonProperty("value")]
     ResourceItemDetailsData[] Value { get; set; }
 }
As you can see, an array of CarbonEmissionDataListResult class objects are in the attribute “value”. The documentation says it should also contain a “nextLink”. I did not see a “nextLink” in my test. The C# class for the detail objects looks like this:
public class CarbonEmissionItemDetailData
{
   [JsonProperty("dataType")]
    public string DataType { get; set; }

    [JsonProperty("itemName")]
    public string ItemName { get; set; }

    [JsonProperty("categoryType")]
    public string CategoryType { get; set; }

    [JsonProperty("groupName")]
    public string GroupName { get; set; }

    [JsonProperty("subscriptionId")]
    public string SubscriptionId { get; set; }

   [JsonProperty("resourceGroup")]
    public string ResourceGroup { get; set; }

    [JsonProperty("resourceId")]
    public string ResourceId { get; set; }

   [JsonProperty("resourceType")]
    public string ResourceType { get; set; }

    [JsonProperty("totalCarbonEmission")]
    public double TotalCarbonEmission { get; set; }

    [JsonProperty("totalCarbonEmission12MonthsAgo")]
    public double TotalCarbonEmission12MonthsAgo { get; set; }

  [JsonProperty("totalCarbonEmissionLastMonth")]
    public double TotalCarbonEmissionLastMonth { get; set; }

    [JsonProperty("changeRatioFor12Months")]
   public double ChangeRatioFor12Months { get; set; }

    [JsonProperty("changeRatioForLastMonth")]
    public double ChangeRatioForLastMonth { get; set; }

   [JsonProperty("changeValueMonthOverMonth")]
    public double ChangeValueMonthOverMonth { get; set; }
}
Please note that in my tests at data type, it says ResourceItemDetailsData, which is not the same as in the documentation. The details of the attributes are as follows: * categoryType (Required, CategoryTypeEnum): This property specifies the item’s category being analyzed for carbon emissions. The category helps segment the data according to different aspects of Azure usage, such as by service type, resource, etc. Understanding the category is crucial for developers to pinpoint areas where carbon emissions can be reduced. * changeRatioFor12Months (Required, number): This numerical value represents the percentage change in carbon emissions for the specified item or category compared to its value 12 months ago. It helps developers assess the long-term effectiveness of their carbon reduction strategies by comparing current performance to past data. * changeRatioForLastMonth (Required, number): Similar to the changeRatioFor12Months, this property shows the percentage change in carbon emissions compared to the previous month. It provides insights into the short-term impact of changes made to Azure resources or usage patterns, helping developers quickly adapt and improve their sustainability efforts. * changeValueMonthOverMonth (Required, number): This property indicates the actual difference in total carbon emissions between the current reporting period and the last month. It offers a precise, immediate measure of the effect of recent changes, enabling developers to quantify the impact of their recent adjustments or interventions. * dataType (Required, string: ItemDetailsData): Identifies the data type returned by the query. This structure should always be set to ‘ItemDetailsData,’ signifying that the data pertains to detailed insights into the carbon emissions of specific Azure resources or services. * groupName (Required, string): Defines the name of the group associated with the item, which could be a resource group or any other organizational unit within Azure. This classification helps organize and contextualize the carbon emissions data within specific segments of an organization’s Azure infrastructure. * itemName (Required, string): Specifies the name of the item for which carbon emissions data is being reported. Typically, this refers to an individual Azure resource for this structure, enabling developers to identify and focus on high-emission areas within their cloud infrastructure. * totalCarbonEmission (Required, number): Reflects the total carbon emissions associated with the item in question, based on the provided query parameters. This figure is vital for understanding the overall environmental impact of specific Azure services or resources. * totalCarbonEmission12MonthsAgo (Required, number): Gives the total carbon emissions for the item as they were 12 months prior, allowing developers to compare current emissions data with historical figures to assess long-term trends and the effectiveness of emission reduction strategies over the past year. * totalCarbonEmissionLastMonth (Required, number): Provides the total carbon emissions for the item for the last month. This enables a month-over-month comparison, helping developers to understand recent trends and the immediate effects of any changes in Azure resource usage or optimization efforts.
Further documentation and resources can be found in Microsoft’s official documentation.
Having these measurements is not enough, though. It is still difficult to say whether your workload is carbon efficient simply by looking at these metrics. Hence, the Software Carbon Intensity (SCI) score by GSF, which calculates the actual carbon efficiency of software.
GSF’s SCI Specification
The Green Software Foundation’s SCI specification provides a standardized approach to measuring the carbon impact of software. It helps understand and improve the sustainability of your digital solutions. The SCI is calculated as:
SCI = C per R
Where C is the total amount of carbon the software causes to emit, the R is the functional unit of the elements in the SCI equation scale (e.g., carbon emissions per additional user, API call, or ML training run).
C could be calculated as:
SCI = (O + M) per R
Where O is operational emissions, and M is embodied emissions (embedded carbon).
O could be expressed as:
O = (E * I)
E is the energy a software system consumes for a functional unit of work in kWh. And I is the carbon intensity of the consumed electricity in gCO2eq/kWh.
And this is where things are starting to get a bit vague. If we read Microsoft’s scope 3 transparency in a document called “A New Approach for Scope 3 Emissions”, the critical sentence I would like to highlight here is:
“Microsoft allocates IT hardware-based Azure cloud service emissions to individual cloud-based customers based on their Azure service usage.”
And how do they define “usage”?
“To allocate Microsoft Scope 3 hardware emissions to Azure customers, Microsoft defines usage as the normalized cost metric associated with infrastructure as a service (IaaS), platform as service (PaaS), or software as service (SaaS).”
The keywords here are “normalized cost metric”. Usage is coupled to cost metrics. Following this documentation, I can’t say for sure that the carbon emissions are derived from consumed energy (E) times the carbon intensity of the electricity at the time (I).
But I would rather not have it linked to usage (read normalized cost metrics). More explicitly, it should be linked to consumed energy and the location-based carbon intensity of the grid at the time of consumption. Plus, I can’t find in the documentation if embedded carbon has been included. But let us just assume here that the carbon emissions provided by the Carbon Optimization Service are operational emissions (O), and let’s move on. We presume embedded carbon (M) has been added. Then we assume we have the total amount of carbon the software emits (C).
Microsoft also mentions a SCI score in their Azure Architecture Center. But their equation is as follows:
SCI = C * R
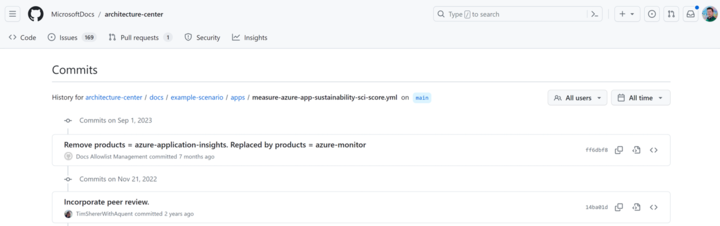
Note how it is not per R. Microsoft says you can score the overall effect of the usage of the application this way (e.g., average concurrent users for the considered time window). But I’m afraid this article is outdated as there is no mention of the Carbon Optimization Service, and the last commit was seven months ago to replace Application Insights with Azure Monitor:
I am not sure if the carbon emissions from Azure’s Carbon Optimization match with GSF’s C, but that doesn’t mean the metrics from the Carbon Optimization Service are useless. Again, they are acceptable for reporting purposes and as a first step towards greener software on Azure. I would simply use them as the C in the equation for now.
Conclusion
In conclusion, as we traverse the path toward sustainable software engineering, we recognize the critical role of accurate measurement in reducing carbon emissions on Azure. The introduction of Azure’s Carbon Optimization Service marks a significant advancement, transforming the challenging task of emissions measurement into a more accessible and actionable endeavor. By leveraging this service, along with the principles of the Green Software Foundation, we can more effectively navigate the journey towards energy efficiency, hardware efficiency, and carbon awareness. With these tools and insights we are not there yet, but we are better equipped to implement meaningful changes, making our software solutions more efficient and environmentally friendly.
This article is part of XPRT.#16. You can download the magazine here.
.png?width=550&height=367&name=OOM2024049%20XMS_XPRT_16_mockup%20(2).png)
Explore deeper into the world of innovation—visit our library, 'Your Essential Guides to Innovation and Expertise,' and access a collection of magazines and eBooks that will transform your understanding of cutting-edge technology and inspire your next big idea.