

Share


What is the most popular data technology? As part of their international research into the use of data and AI, the team behind Data Survey 2018 - 2019 collected the insights of no less than 1,345 professionals from all over the world. They were surveyed about the solutions they use when it comes to data technology, cloud platforms, and data visualization tools. This research is the result of a collaboration between Big Data Expo, GoDataDriven, and Computable.
Deployment of Data Technology Is Increasing
Compared to last year’s report, which surveyed 804 participants, there is a clear increase in the use of data technology across the board. The total percentage of top data technologies deployed by the top 25 organizations increased by 40% compared to last year. This means that data technology is becoming increasingly common in the business world. The research shows a clear preference for certain technologies (such as Microsoft Azure and SAS) in smaller organizations as well as in organizations with over 1,000 employees.
“Python is the most popular language/technology, Azure the most popular platform, and Tableau the most popular data visualization tool.”
Especially in terms of technology (Python versus R) and data visualization tools (Tableau versus PowerBI), it’s a close race to become the incumbent. Although the number of organizations using data technology is increasing, the top five data technologies have mostly remained stable compared to last year. However, Spark has significantly increased in popularity compared to other technologies.
The use of cloud technology is increasing. Government agencies and health care companies in particular tend to use a closed environment - locally or using private cloud.
The range of data visualization tools is impressive, however, the participants do show a clear preference for Tableau, PowerBI, and Qlik.
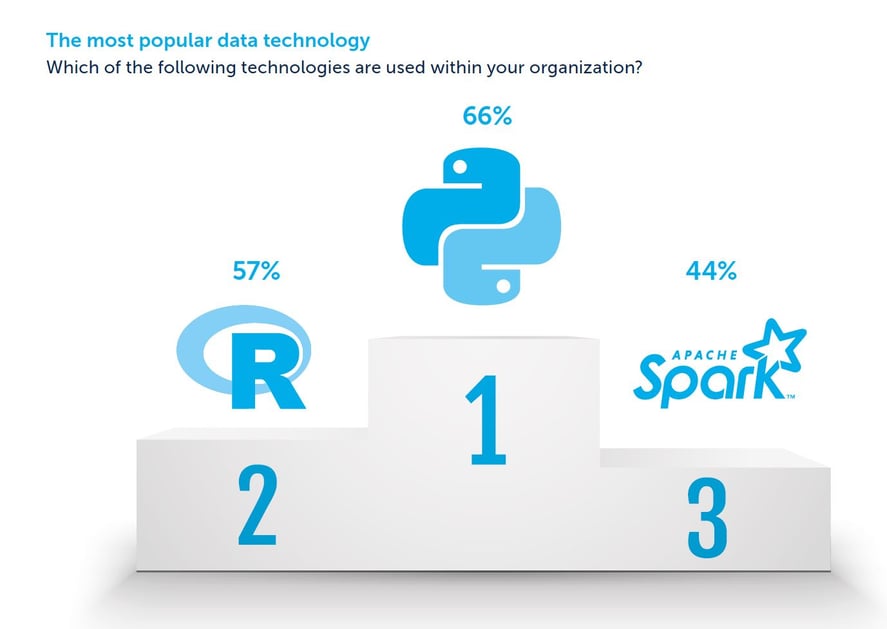
The Most Popular Data Technology
Other than Python switching places with R and taking the spot for most popular data technology tool, there’s been little shifting within the top five. The market share significantly increased for Python (from 29.5% to 66%), R (from 40.8% to 57%), and Spark (from 23.1% to 44%). Although the share of the remaining two parties in the top five (SPSS and SAS) also increased, the percentage changes are minimal; from 20.8% to 26% and from 17.7% to 22% respectively.
The emergence of Spark goes hand in hand with the rise of Databricks (from 2.7% to 8%), a platform solution built around Spark. One of the declines compared to last year is DataStax (from 3.1% to 1%).
Looking more closely at the different sectors, there are a number of points that immediately stand out. R is more popular than Python when it comes to financial services (68% versus 63%) and health care (75% versus 55%). In contrast, R is much less popular in telecom (38%), production (36%), and retail sectors (34%).
Spark’s popularity is above average in the telecom and travel sectors, holding 88% with both. Kafka is a technology that is mainly used within the telecom sector (42% versus 13% in other sectors). The same applies for Elastic (28% versus 17% on average).
“A data-driven approach is not just about data and technology. In previous years, support from management in particular proved to be a crucial success factor.”, said Walter van der Scheer, co-initiator of Data Survey.
It is mainly large organizations with over 1,000 employees who use Spark (62%). Within this group, SAS is also more popular (39%) than it is among different-sized organizations (12%).
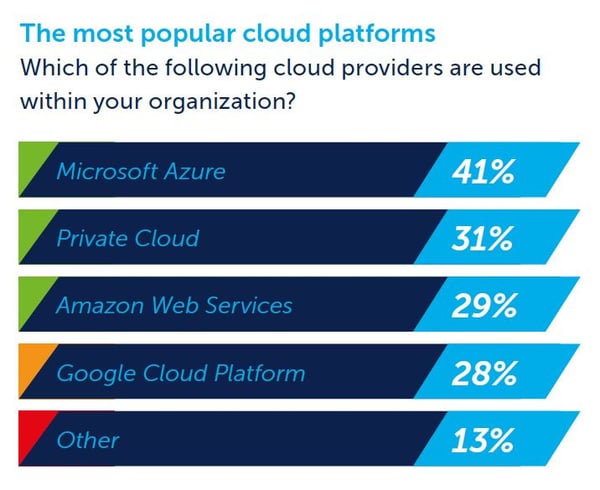
The Most Popular Cloud Platforms
Data Survey 2018 – 2019 shows that Microsoft Azure is the most popular cloud platform at 41%. Private cloud platforms, Amazon Web Services, and Google Cloud Platform are neck and neck with 31%, 29%, and 28% respectively. Respondents indicate that they also work with suppliers such as IBM, Fujitsu, KPN, Leaseweb, Oracle, SAP, and Salesforce. 3% of the participants indicate that they do not work with a cloud provider.
 It is mainly organizations in Media & Entertainment (63%), Travel & Telecom (47%), and Retail (41%) who work with Google Cloud Platform. The use of Amazon Web Services is evenly distributed across all sectors, while private cloud is particularly popular among government agencies (55%) and health care companies (47%). Microsoft Azure has the highest adoption level in financial services (51%) and utility organizations (54%).
The Most Popular Data Visualization Tools
When visualizing data, one can make abstract information more tangible, enabling easier decision-making based on actual facts rather than gut feeling.

Here we see three parties firmly at the top, with a clear difference between developers and other professions.
The top 3 tools - Tableau (33%), PowerBI (32%) and Qlik (21%) - account for a market share of 86%. The large vendors SAS (13%) and IBM (11%) are narrowly preceded by ggplot (15%), the data visualization package for the statistical programming language R. It should therefore be no surprise that, at 39%, ggplot is the most popular data visualization tool among developers. With 30%, Plotly is another popular tool among developers.
In the United States, Tableau (33%), SAS (29%), and Qlik (24%) are the most important tools when it comes to data visualization, while in the United Kingdom PowerBI is by far the most popular tool at 40%.
Finally, it is primarily organizations with over 1,000 employees that opt for SAS (23% versus 7% of smaller organizations).
Download the complete Data Survey 2018-2019 report!