

Share


Ever heard of the English saying: "when it rains, it pours", meaning whenever something bad happens, it's usually not alone? It's an old saying, appearing in books written in the 17th century, but it applies equally today in the case of IT monitoring.
If an alert is triggered somewhere in your IT landscape, chances are many more alerts about components related to the original one will go off as well. The resulting "alert storm" can overwhelm IT operators, obfuscating the true cause of the problem and crippling the team's ability to respond.
StackState's AIOps product helps users weather the storm by combining related alerts into a single problem card and pinpointing the root cause of the issue so it can be dealt with swiftly and effectively.
StackState's Topology
StackState collects and combines data from different IT monitoring tools to build a complete picture of your IT landscape. With each tool seeing only a piece of the puzzle, StackState fits those pieces together to create a seamless overview.
All of those tools were never meant to work together, it's like they speak a different language.
All information from the tools is translated into a common language before being processed. This language is called the 3T model and consists of topology, telemetry and time. Topology helps us when we have to deal with an alert storm.
Taming the Storm
The topology in StackState is a representation of your IT landscape. It consists of components and their dependencies. Components are physical or virtual parts of your IT environment -- physical servers, virtual servers, applications, databases, containers, routers, etc.
Components have dependencies on each other which determine what components are needed for a component to do it's job. In a traditional 3-tier application, the front-end component has a dependency on the application component which, in turn, has a dependency on the database. If the database fails, this affects the application and front-end components both.
When alerts occur, StackState uses the topology to group failures on higher levels under failures on a lower level.
Putting It To Work
Let's say you have setup StackState to monitor your IT landscape. Here is an example of what that might look like:
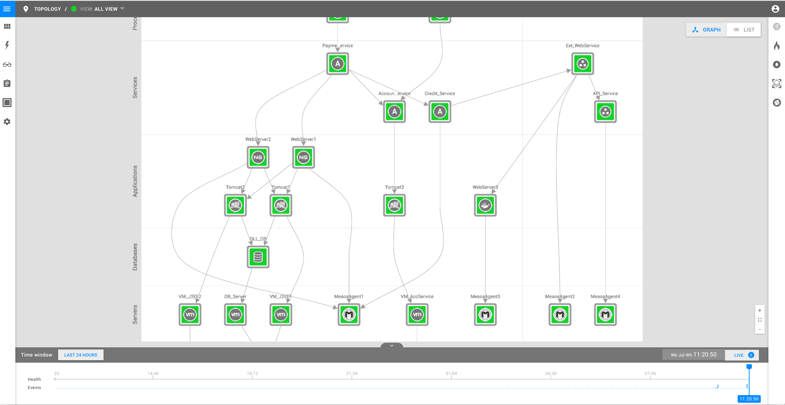
The picture shows an environment consisting of a payment service (top left) and the associated IT resources that make it function:
- two web serves
- two Tomcat servers
- and a database for storage
Now, suppose the database slows down due to a bug in your new software release. StackState detects this issue and shows it in the problem pane:
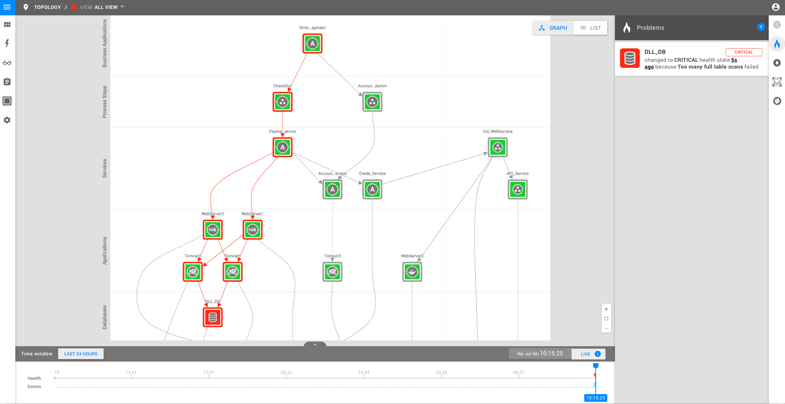
The issue card shows the root cause 'DLL_DB' as the header and explains why the component is in critical state. Using the link in the text, users can time travel back to the moment the check failed to see the exact state of the entire landscape at that time. Note that StackState also highlights potentially impacted components in the topology view by surrounding them with a red border.
A slow database will cause all of the queries executed on the database to take longer than usual. If the database is accessed via a web application, the requests on that service will take longer, too. In our example, the Tomcat servers accessing the database also trigger an alert.
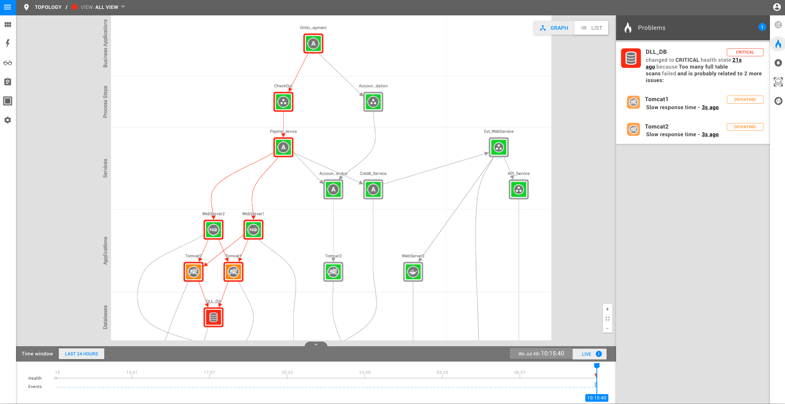
Because StackState is aware of the dependencies in your landscape, the Tomcat server alerts are not surfaced as independent issues, rather they are added to the issue card showing the database problem. As an IT operator, you now know you don't have to investigate the Tomcat server problems (since they are likely a symptom of a larger issue) and to instead focus your efforts on the database problem.
Finally, the payment service itself triggers an alert because, due to the Tomcat servers and database server being slow, it fails to meet its SLA.
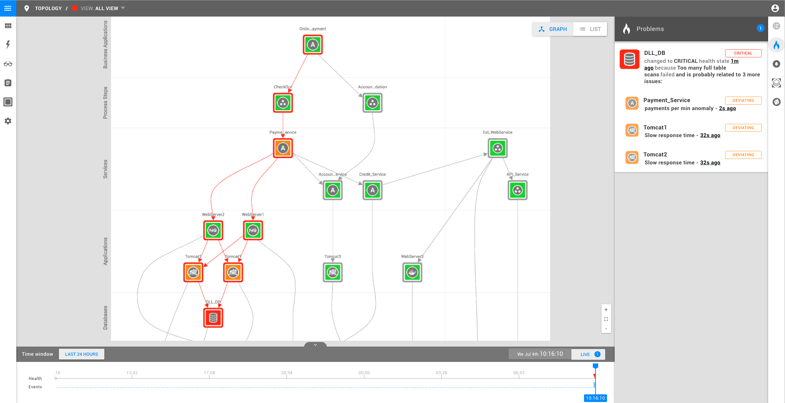
Again, the payment service problem is grouped under the database root cause, based on the topology. Engineers know which of the issues to attack and which to ignore for the moment.
Shared Understanding
StackState's problem pane is even more powerful when shared between teams. Imagine that the payment service is managed by separate Database, Development and Business teams. Without a common dashboard, each team would look at their part of the world (the database, the application or the business service) and, based on the alerts described above, conclude there is an issue in their part of the application.
Using StackState as a common dashboard, the Development and Business teams would know the root cause of their alerts is a database problem and so would only need to monitor the resolution of the issue instead of jumping into firefight mode. This saves countless interruptions and effort when applied at enterprise scale.
Want to learn more about AIOps?
Download our free 'guide to AIOps' and take the first step towards AIOps. Get your copy and you'll learn:
- The essentials and benefits of AIOps
- The different data sources and tools that can be analyzed
- Modern AIOps features & requirements you should look for
- How to help IT Operations & DevOps deliver efficient and high quality services - with zero blind spots