Fast-growing startups with a web-based SaaS product often fear their success will become their worst enemy, and rightfully so. The challenge of scaling is both organizational and technical. You need to make sure that your software scales to the number of users you could acquire.
SaaS products need to adapt to increasing user numbers at a decreasing cost per user. Fortunately, computers and storage have continually become cheaper and faster, but that still hasn’t made scaling much easier. You also need to scale your compute storage to meet an ever-increasing need for automating infrastructure provisioning and software deployment. A single machine must be able to handle a substantial number of users. Distributing roles over several machines (vertical scaling) or adding machines (horizontal scaling) allows the number of users to grow without an adverse impact on the application user’s experience. Your software must be created with scalability in mind, and this article explains the ideal scalability architecture in more depth later.
Scalability: The Problem Explained
The problem of scalability is often perceived as a luxury problem because it will only occur after a startup achieves some success. But it can also lead to the startup’s downfall. If a product is successful, it’s easy to spend all your time onboarding new customers and harder to devote enough time to optimize the application and predictive performance analysis. So in fact, it's a real problem, as the startup’s hard-earned, positive reputation could be easily lost. A downfall in reputation can damage the growth speed of the company, a metric that is very important to investors.
Scalability: Why Everybody is Talking About It
When usage grows without scalable software, you increasingly encounter slow or unresponsive service at peak times. Simply throwing more money (i.e., hardware) at the problem won’t solve it. The engineering team will explain that the software needs rework to operate beyond a certain scale. But reprogramming your software while suffering regular outages can stress out a development team. Here’s how to avoid that:
First of all, since scalability has seemingly become the “holy grail” of application building, most engineering teams have a plethora of ideas about what could be changed to achieve it. They’ll propose specialized hardware, a full rewrite (from scratch), another programming language, non-blocking I/O, an event-loop system, usage of message buses and microservice-based architectures as the key to this "mythical" problem. Fortunately, none of these are necessary, and the solution is quite simple:
Measure your software’s characteristics so that you only need to rewrite the functions that are proven bottlenecks to scaling your application. Here’s how:
Performance Analysis Maturity Levels
There are three maturity levels that can be identified in a performance analysis in a software as a service (SaaS) development process:
- Reactive - Ensure you have profiling tools to improve performance on function calls that customers complain about.
- Pro-active - Set up continuous analysis in production to be able to detect performance degradations before customers experience them.
- Predictive - Set up a performance infrastructure to do usage simulation and performance analysis to predict when customers will hit limits.
To reach each of the maturity levels you need to invest in tooling and writing software. For the first level, you need to use profilers that analyze the call stack (such as Java Flight Recorder). For the second level, you need an application performance management (APM) tool (such as Dynatrace or New Relic). The third level requires an even bigger investment in usage simulation.
Predictive Analysis Requires Usage Simulation
To avoid problems, you must be able to predict when you will hit performance limits. Programming software that does proper usage simulation is the key to this level of performance analysis. Create personas and determine their typical behavior. Then, scale the test to the right number of users. Make sure you have a set of machines where you can replicate your production setup exactly, then run your test against it.
Automate the provisioning of these machines with Ansible, Chef, Salt, Puppet or CFengine. That way you can easily roll out your performance platform on different clouds and hardware configurations to evaluate their performance. You can also redo your setup to ensure that your tests are valid. Discovering the number of users it takes to collapse your application is the first step. Next, determine how you to do something about it.

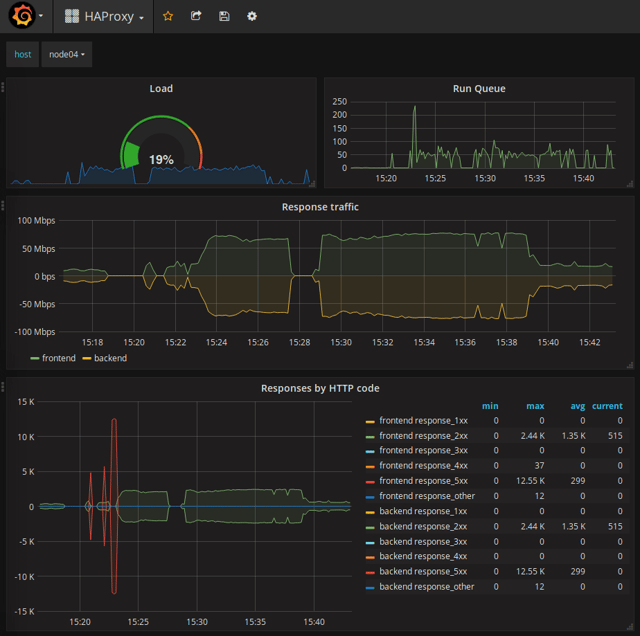
An instrumented Haproxy under load
SIGAR: A Five-Step Approach
To achieve high-performing software, follow the five steps below with care and in order:
- Simulate usage realistically (program some Gatling tests)
- Instrument systems extensively (use Collectd, Kamon, Dropwizard, FastJMX)
- Graph measurements interactively (use Grafana and InfluxDB, a time-series DB)
- Analyze graphs thoroughly (must be done by the development team)
- Repeat steps frequently (to prevent performance degradation)
There is one step is missing from the “SIGAR” method above; the (minimal) code adjustment. However, once the development team has programmed a simulation and analyzed the results, those optimizations won’t get talked about much. It’s better not to ask why the performance was bad, as there is often little to learn. It’s better to discuss the potential and actual performance improvements. Improving performance should not be about blame, it should be a winning experience.
Meaningful Statistics
Most systems monitor frequency and the average duration of function calls. You can calculate a "slow query log" statistic with this information, which can be useful for reducing response time, but not so good for performance optimization.
When creating graphs to analyze performance we are ideally looking at time-consuming statistics. These are statistics that allow you to compare cheap, highly frequent function calls with expensive incidental function calls. The graph calculates the amount of microseconds elapsed during all invocations of specific function calls in a usage simulation.

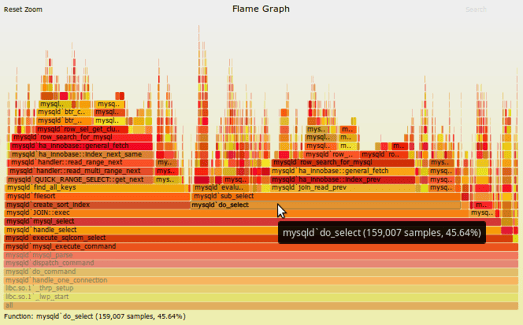
A flame graph showing sampled stack traces (source: Brendan Gregg)
Examples of useful graphs:
- New Relic’s "Most Time-Consuming" lists
- Brendan Gregg’s flame graphs representing stack samples
- Graphs or top lists you create yourself by adding up all microseconds of wall-clock time elapsed on all API or repository calls
You can create the last type of graph by storing ever-increasing counters (representing invocation count and elapsed time) in a Redis “hash” data structure.
Summary
Using predictive performance analysis you can ensure that your software scales to the number of users you could acquire. Predictive performance analysis is done by simulating usage on instrumented software. Graph and analyze it using tools like profilers, APM and time-series databases, and repeat if necessary.


